- About
- Academics
- Admissions & Aid
- Life
- Centers, Research & AI
- Centers
- Andrew Young Center for Global Leadership
- Martin Luther King Jr. Collection
- Center for Black Entrepreneurs
- Center for Broadening Participation in Computing
- Center for Excellence in Education
- Center for Sustainability
- Ida B Wells Society
- Innovation and Entrepreneurship Center
- Morehouse Writing Center
- Institutes
- Research at Morehouse
- AI at Morehouse
- Centers
- News & Events
- NSO - Orientation
Student Achievement at Morehouse College
Morehouse College identifies, evaluates, and publishes goals and outcomes for student achievement appropriate to its mission, the nature of the students it serves, and the programs offered. In response to SACSCOC’s August 15, 2018 request to member institutions, to identify a self-selected undergraduate student completion metric, the College selected IPEDS 4-year (100% standard time to program completion) and 6-year (150% standard time to program completion) graduation rates. Graduation rate serves as only one of the College’s three measures to document student achievement. In total, the College has identified the following measures: retention rates, graduation rates, and post-baccalaureate placement to document student success.
Morehouse is committed to developing men with disciplined minds who lead lives of leadership and service. The 2021-2026 strategic plan elevates this mission by prioritizing goals to ensure graduates’ success. These goals are organized under four strategic themes, and each of the College’s student achievement measures aligns directly with the institution’s mission and strategic themes.

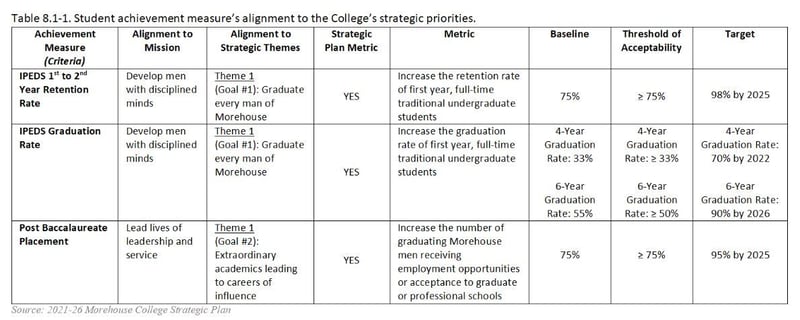
Table 8.1-1 illustrates this alignment, mapping each student achievement measure to the College’s strategic priorities. Additionally, the table outlines the metric used to evaluate success and the established baseline, threshold of acceptability, and target growth.
The College consistently evaluates its Strategic Plan metric attainment and student achievement measures. The Office of Strategy and Planning manages the formal evaluation of the College’s strategic plan. Concurrently, the Office of Data Analytics, Institutional Research and Effectiveness (DIRE) annually monitors efforts toward student achievement through operational planning and publication of the College’s Factbook.
Retention Rates
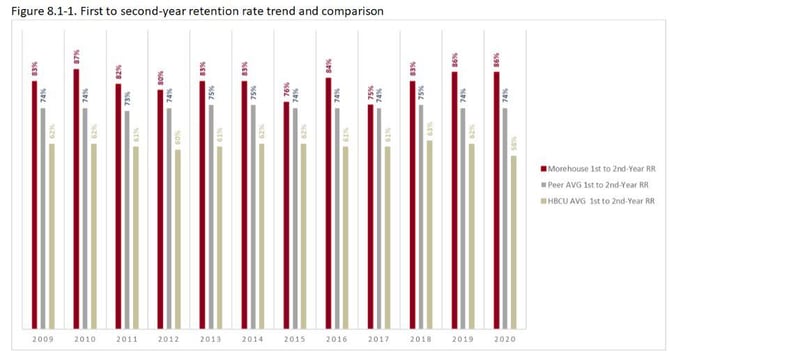
Retention rates are a crucial indicator of the quality of programs and services institutions provide. To maintain these rates, institutions must attract, engage, and support students, ensuring the completion of their academic programs and, ultimately, their goals. Morehouse College monitors first to second-year retention rates to assess academic and student service success. The College has set a threshold of 75% for the second-year retention rate, the minimum rate reported for the 2017 cohort. The College aims to exceed this threshold to achieve a target rate of 98% by 2025. Additionally, Morehouse aims to meet or exceed the average second-year retention rate for historically Black colleges and universities (HBCUs) and private not-for-profit four-year institutions with similar missions.
Table 8.1-2 summarizes the most recent retention rate data published in the IPEDS Data Center (cohort 2020). The College maintains positive achievement indicators compared to the acceptability threshold, average HBCU first to second-year retention rates, and peer institutions’ first to second-year retention rates.

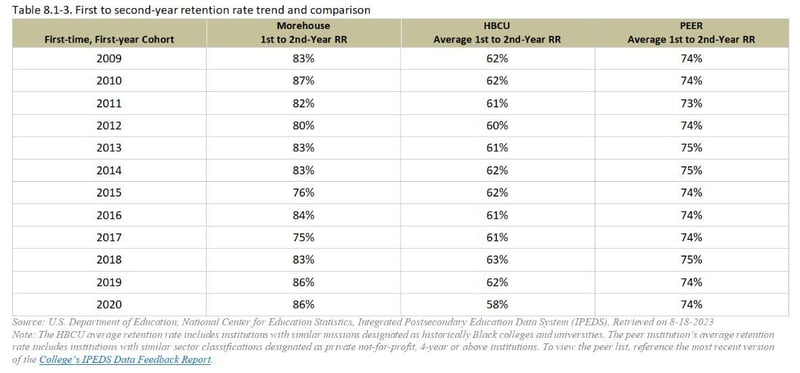
Table 8.1-3 and Figure 8.1-1 summarize the College’s first to second-year retention rates compared to the average for all HBCUs and peer institutions. Morehouse consistently surpasses the average first to second-year retention rates for HBCUs and its peers, averaging a rate of 82% over twelve-years. For academic years 2020 (cohort 2019) and 2021 (cohort 2020), Morehouse maintained an 86% second-year retention rate.
Graduation Rates
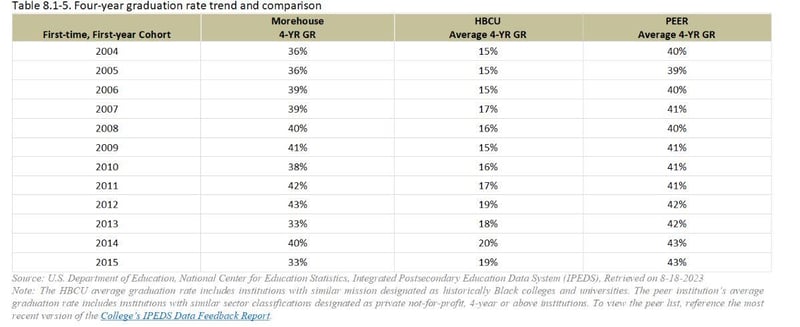
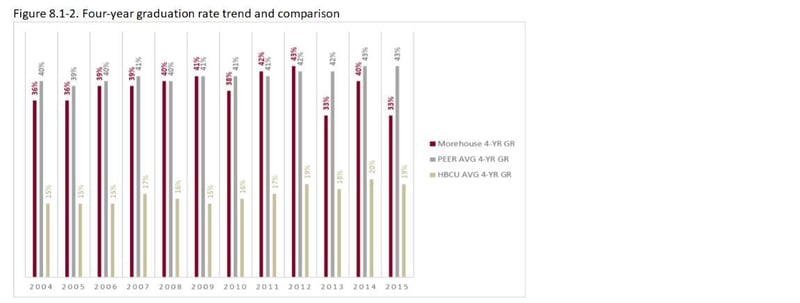
Graduation rates are a crucial indicator of institutional program and service productivity. This metric reflects the number of newly enrolled students, their timely matriculation, and completion of their chosen degree. To maintain these rates, institutions must attract, engage, and support students, ensuring the completion of their academic programs and, ultimately, their goals. Morehouse College monitors graduation rates to assess academic and student service success. The College has set a threshold of 33% for the four-year and 50% for the six-year graduation rates, the minimum rates reported for the 2013 and 2010 cohorts, respectively. The College aims to exceed these thresholds to achieve a target four-year rate of 70% and a six-year rate of 90% by 2026. Additionally, Morehouse aims to meet or exceed the average graduation rate for historically Black colleges and universities (HBCUs) and private not-for-profit four-year institutions with similar missions.
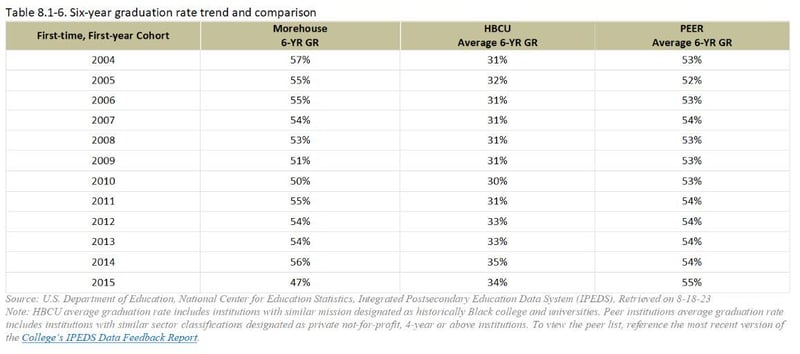
Table 8.1-4 summarizes the most recent data published in the IPEDS Data Center (cohort 2015) for graduation rates. The College measures positive achievement indicators, compared to the threshold of acceptability for the four-year graduation rate and HBCU comparisons for four and six-year rates. However, data shows the College has fallen three percentage points below the threshold of acceptability for the six-year graduation rate. Additionally, cohort 2015 fell ten percentage points below the peer four-year average graduation rate and eight percentage points below the peer six-year average graduation rate.
Table 8.1-5,6 and Figure 8.1-2,3 summarizes the College’s graduate rates compared to all HBCUs and peer institutions’ average graduation rates for the indicated cohort. Morehouse maintains a consistent four-year and six-year graduation rate, averaging a four-year graduation rate of 38% and a six-year graduation rate of 53%.
Post Baccalaureate Placement
Morehouse graduates are expected to lead lives of leadership and service. In the Strategic Plan, Theme 1 (Goal #2) sets forth the expectation of providing extraordinary academics that lead to careers of influence. Therefore, the College monitors post-baccalaureate placement rates to gauge the productivity of academic programs and student service success. Annually, the College obtains information on job placement data and graduate and professional school acceptance data from the College’s Senior Exit Survey and the National Student Clearinghouse. Success is measured against the threshold of acceptability established in the Strategic Plan and national placement rates from the most recent National Association of Colleges and Employers (NACE) First Destination Survey. Table 8.1-8 summarizes the class of 2022-23’s placement achievement.
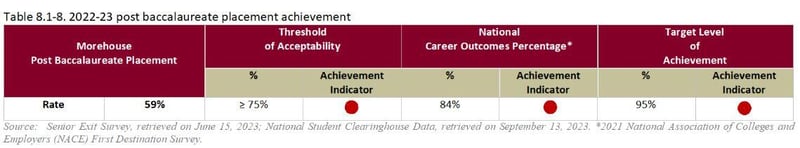
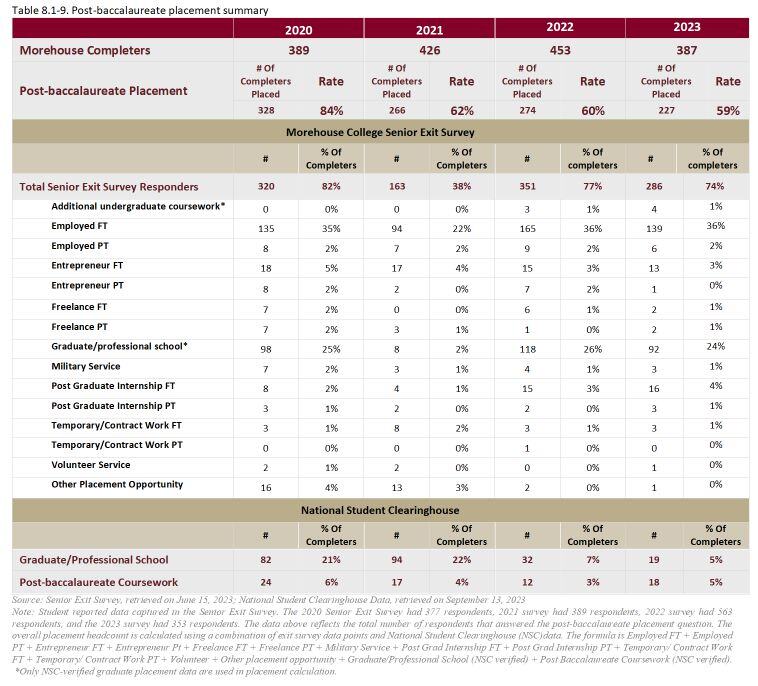
The percentage of graduates securing employment or educational opportunities since 2020 has declined. However, despite the challenges institutions faced post-COVID, between 2021 and 2023, Morehouse has held a steady post-baccalaureate placement rate, which hovers at 60%. While the current placement rate is lower than the identified achievement indicators, Morehouse is committed to ensuring a return on investment for its families.
The information presented in Table 8.1-9 outlines the post-baccalaureate activity of Morehouse graduates. In 2023, 59% of the College’s graduates secured employment or educational opportunities after graduating. Half of the graduates obtained employment, and 45% of those opportunities were full-time jobs with pay. Additionally, 25% of the 2023 graduating class reported acceptance into a graduate or professional school.
Graduation Rates by Socioeconomic Status
Morehouse disaggregates graduation rate data by socioeconomic status (SES) to maximize institutional effectiveness in student achievement. Disaggregating graduation rates by SES provides insight into the impact of Pell recipients on Morehouse’s overall graduation rate and promotes targeted wraparound services for low SES students. The College does not collect household income data for all students; therefore, low SES is determined by whether a student received a Federal Pell Grant during the academic year. To qualify for a Pell Grant, the student must meet certain income requirements in relation to their household size. This method is a common approach used by colleges and universities to measure SES diversity in higher education and examine the impact of poverty on student success.
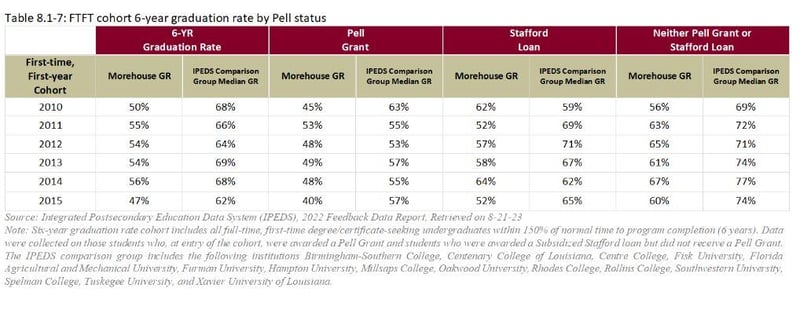
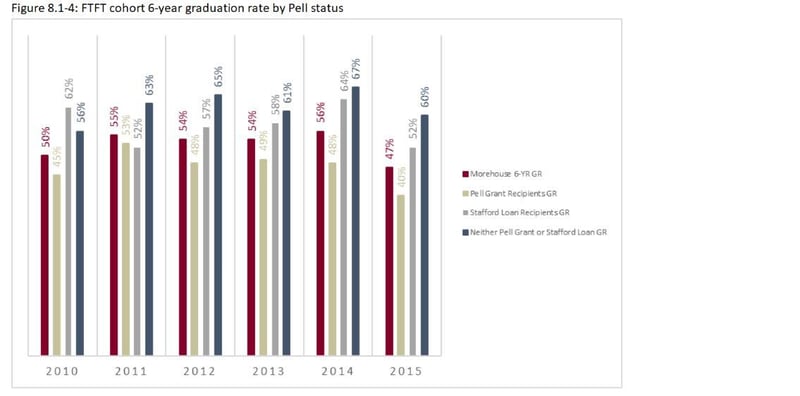
Table 8.1-7 and Figure 8.1-4 summarize the College’s six-year graduation rates disaggregated by Pell and Stafford Loan status. Morehouse continues efforts to exceed the IPEDS comparison group median and increase Pell recipient completions. Over the six-year timeframe examined, Morehouse’s non-Pell recipients outperformed its Pell recipients.